Data does not always guarantee visibility. More often than not, CISOs find themselves entangled in a maze of tools offering siloed views of security and performance. And with such skewed views, organizations are often susceptible to blind spots that can be extremely hard to trace and resolve.
With a lack of insightful and actionable data, CISOs are often stuck putting out fires as they appear rather than taking a more proactive approach to risk. That’s where cybersecurity dashboards come into play. .
A well-designed cybersecurity dashboard can help gather crucial data and derive actionable insights that CISOs can use to make data-driven decisions. This blog aims to help you create an effective cybersecurity dashboard while highlighting the key metrics that can help in smarter decision-making.
TL;DR
| Building a cybersecurity dashboard as per your business context requires a selection of key metrics ranging from training completion rates, risk assessment scores, intrusion attempts and third-party risk score to patching cadence, control readiness and IAM metrics. |
| Manually creating cybersecurity dashboards requires consolidating data from diverse sources and selecting a dashboard platform to display the integrated data |
| An alternate is to use integrated and comprehensive platforms that use AI and machine learning to derive real-time insights |
What is a cybersecurity dashboard?
A cybersecurity dashboard is a data visualization tool that provides real-time insights into an organization’s security posture. It consolidates and centralizes key metrics on threats, compliance status, performance, and other security data. The dashboard also uses graphs, charts, and visuals to make the data easily understandable.
Important metrics to track in the cybersecurity dashboard
You can create a customized cybersecurity dashboard tailored to your unique requirements and business context. However, here are some key metrics that you can track:
1. Training completion rate
The training completion rate is the percentage of people who have successfully completed cybersecurity awareness training out of the total number of people enrolled. A high completion rate, essentially above 90%, is considered ideal and indicates that the workforce is well informed on cybersecurity practices and prepared to handle threats.
Where can you find this metric?
You can find this data on training platforms such as KnowBe4, integrated learning management systems, or GRC platforms like Sprinto.

2. Phishing test success rate
Phishing test success rate showcases the percentage of people who have successfully identified phishing attempt and avoided an attack. It reflects strong cybersecurity awareness where employees are not deceived into revealing sensitive information such as login credentials or any financial data. The ideal success rate should be 95% or more.
Where can you find this metric?
You can find phishing test success rates on email security platforms such as Cofense, security awareness platforms like KnowBe4 or phishing simulation tools.
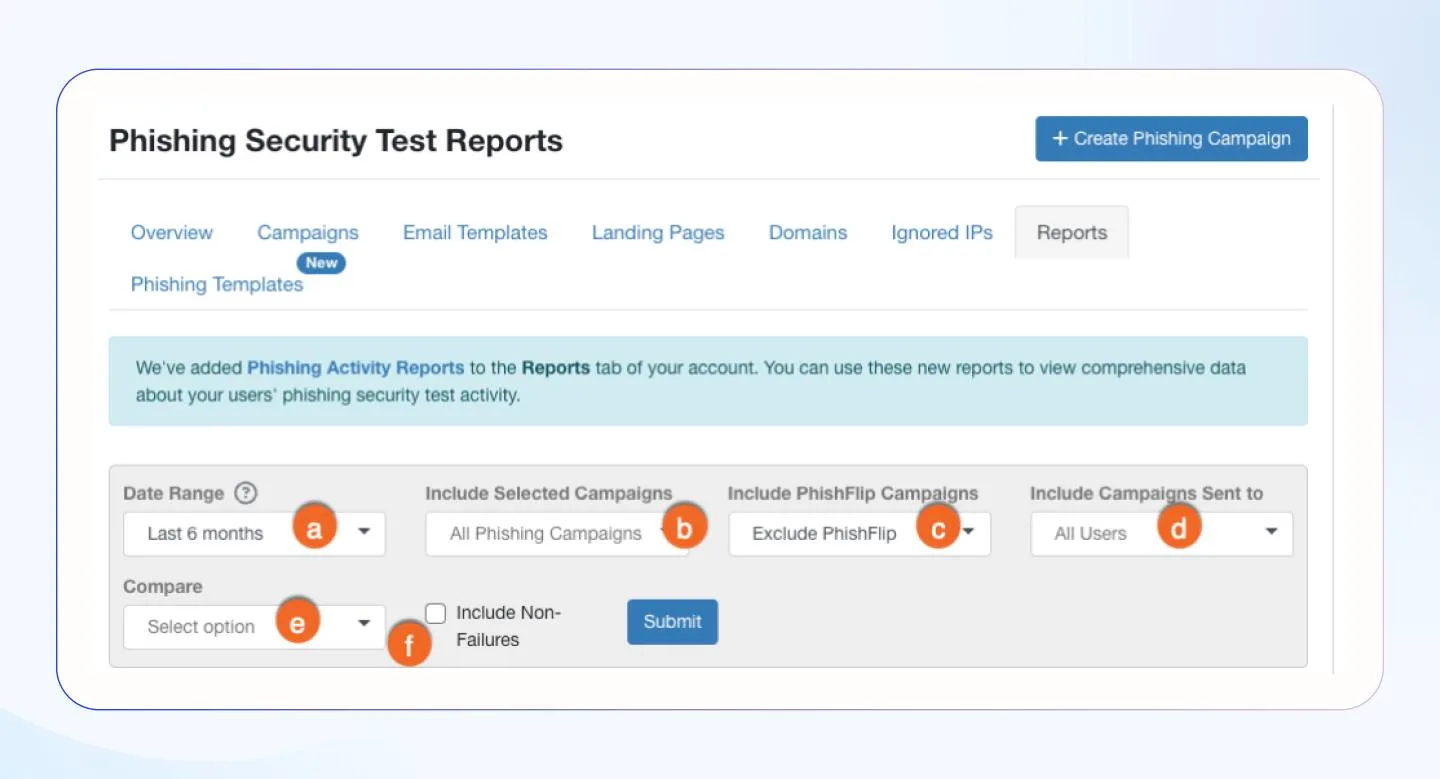
Here’s a cybersecurity dashboard example from KnowBe4:
Get real-time insights with Sprinto
3. Risk assessment scores
Risk assessment scores reflect quantitative values assigned to the potential risks the organization is exposed to. These risk assessments use predetermined criteria and consider the likelihood and impact of risks. A higher average risk score indicates more risk and vice versa.
Where can you find this metric?
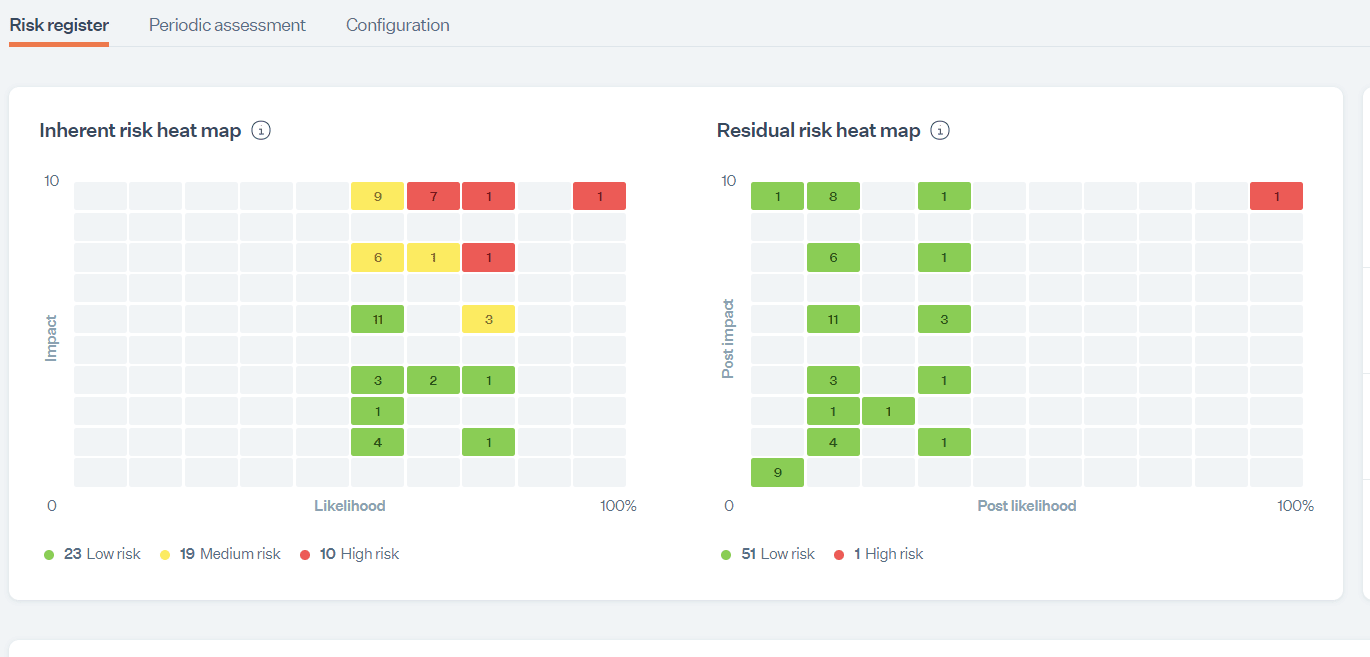
If you use risk management tools such as RiskWatch, you’ll find the data there. You can also find these on Sprinto, and here’s what it looks like:
4. Third-party risk management metrics
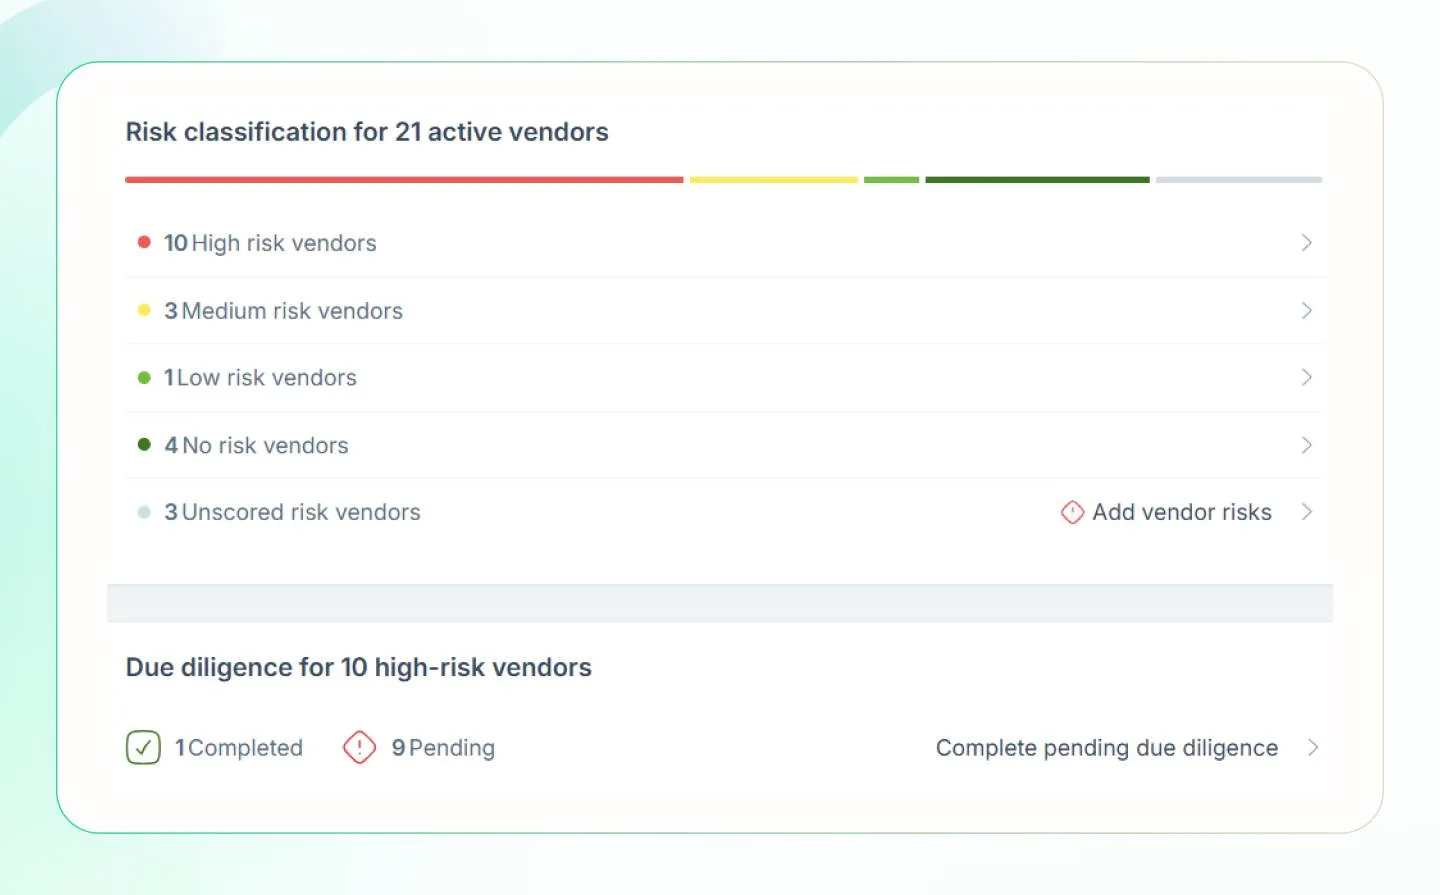
Third-party risk management metrics help understand vendor risk profiles and security postures. They indicate how well the vendors comply with cybersecurity standards and align with your security and compliance objectives. You can track their risk ratings, due diligence scores, risk assessment completion rate, and compliance with regulations such as SOC 2, ISO 27001, etc.
Where can you find this metric?
These metrics can be found on third-party risk management tools such as Archer and Third-party governance, vendor security rating platforms such as Bitight and Sprinto.
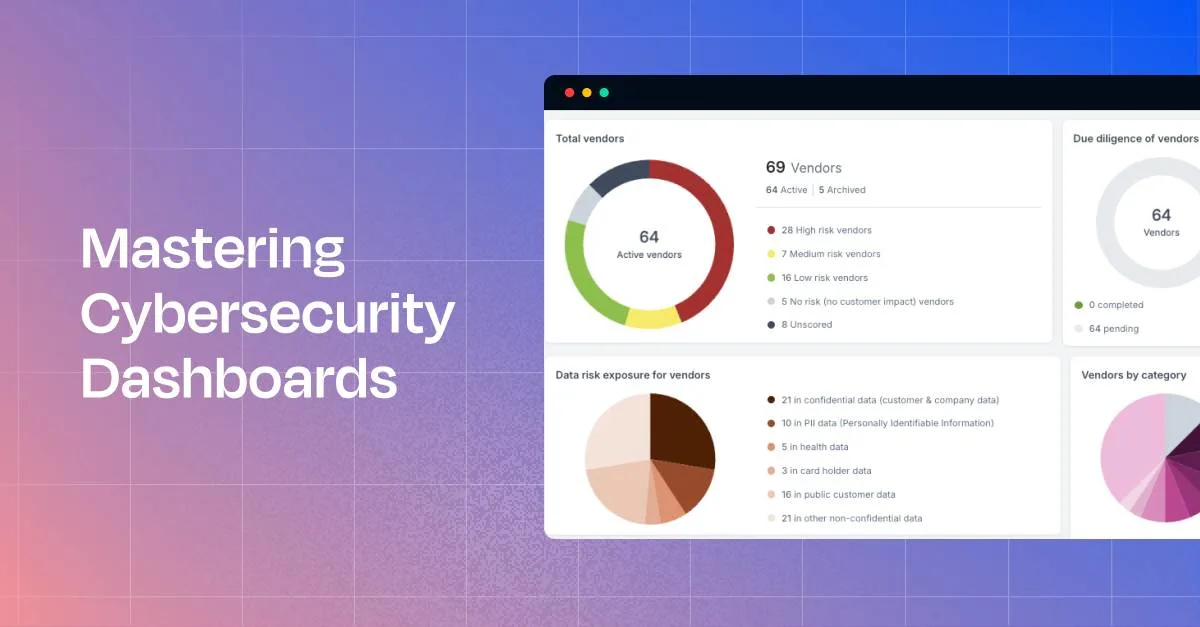
This is what the Sprinto’s dashboard looks like:
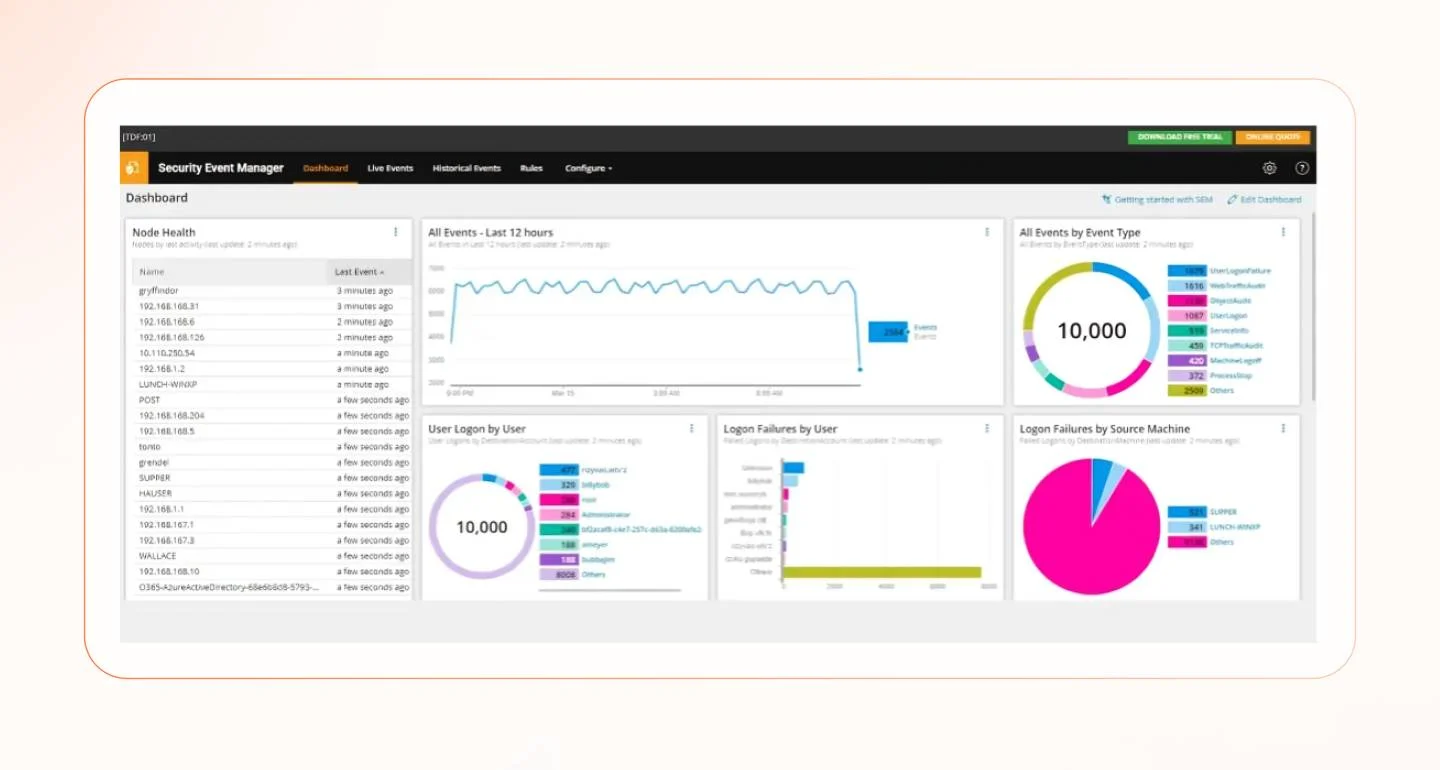
5. Intrusion attempts
Intrusion attempts metrics help track the number of unauthorized attempts to gain access to systems. The insights into how many times the system has been targeted provide an understanding of the effectiveness of network security measures. You also understand the frequency of such cyber attacks to introduce new improvements to the security fabric.
Where can you find this metric?
Intrusion detection systems and Security Information and Event Management (SIEM) tools can help you with this data. Solarwinds Security Event Management and IBM QRadar are examples of such tools.
Here’s a cybersecurity dashboard example from Solarwinds:
6. Mean time to detect
The mean time to detect is the average time security teams take to detect an incident after it has occurred. It indicates the organization’s proactiveness and speed to quickly identify and mitigate any potential damage and the effectiveness of monitoring and alerting systems. A lower MTTD saves costs and enhances the team’s incident response capabilities.
Where can you find this metric?
Tools like Palo Alto Networks Cortex XSOAR enable automated responses and orchestration to track such metrics.
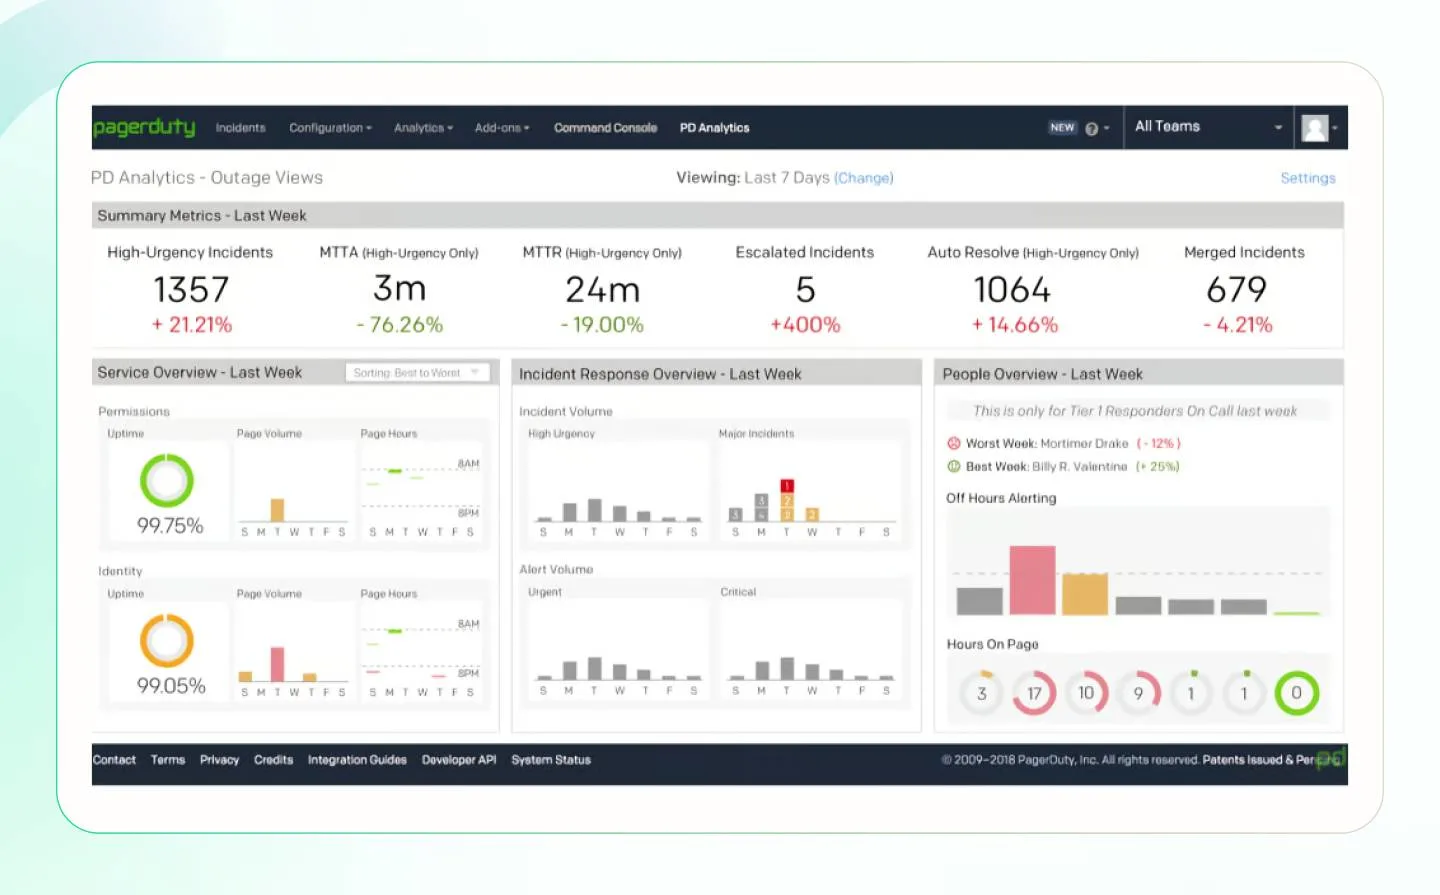
7. Mean time to Resolve
Mean time to Resolve is the average time security teams take to resolve the incident from the time of detection fully. This includes the time taken for containment, eradication of the root cause, and recovery. The metric works with MTTD and helps senior management understand the efficiency of the incident response process in minimizing downtime and operational disruptions. A lower MTTR is better for reducing overall cyber risks.
Where can you find this metric?
Incident management tools with automated workflows, such as PagerDuty can help you track MTTR.
8. Patching cadence
Patching cadence is the frequency with which an organization tests and applies patches and updates across the IT infrastructure. It’s a good hygiene practice and is in fact required by many compliance frameworks. A good patching cadence indicates a proactive approach to vulnerability management and helps improve security.
Where can you find this metric?
Vulnerability management and patch management tools offer insights into patching cadence. Examples include Qualys Vulnerability Management Detection and Response and Ivanti Patch Management.
Here’s what the Qualys dashboard looks like:

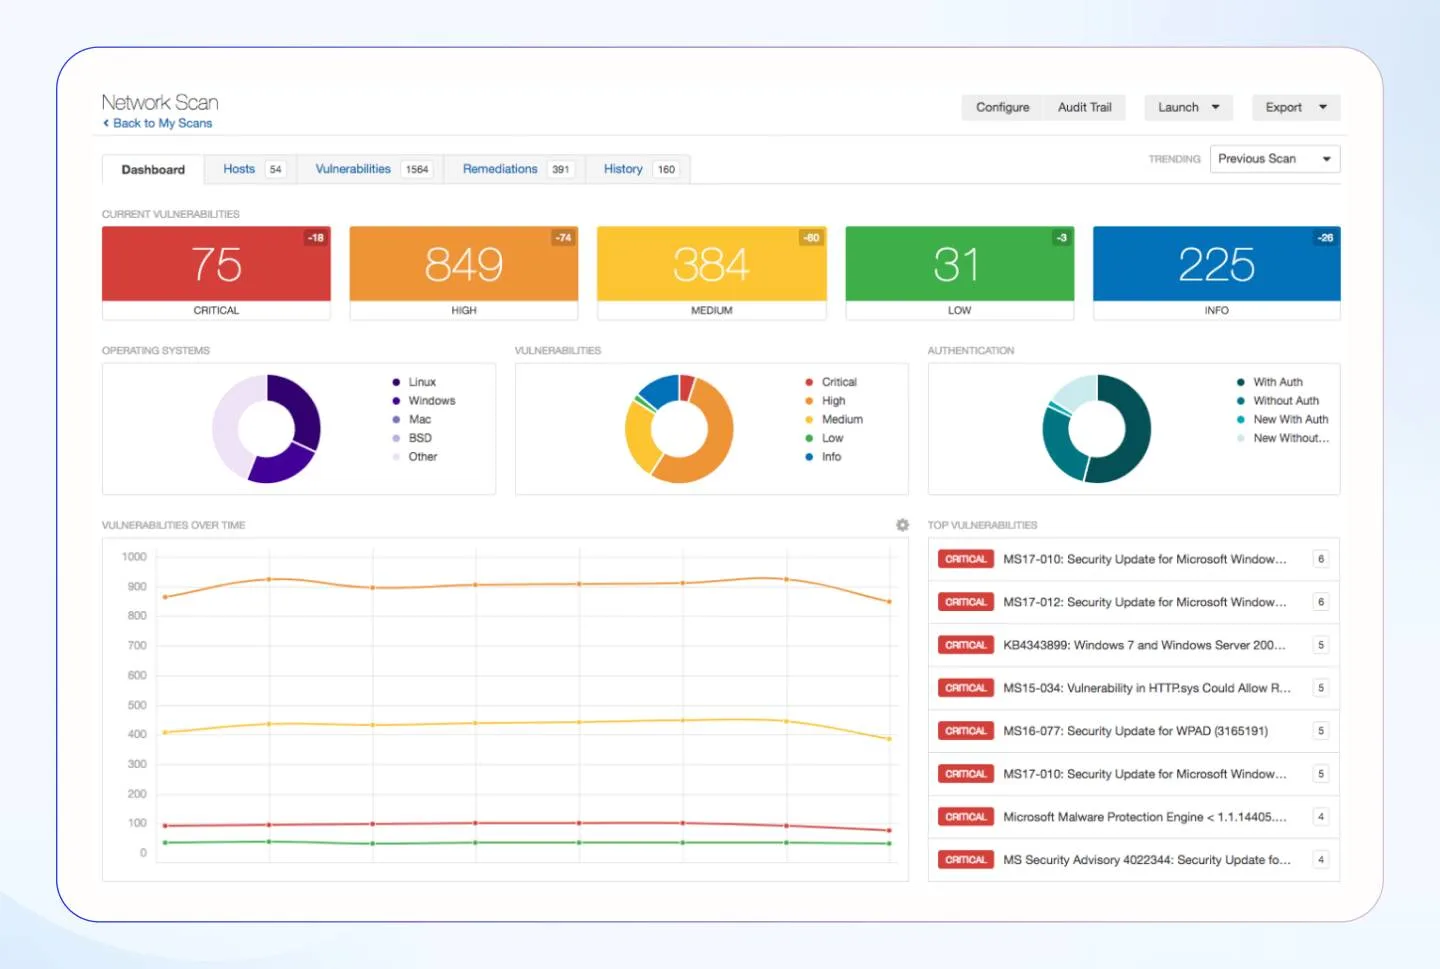
9. Vulnerability assessment results
The vulnerability assessment results on the dashboard indicate the potential vulnerabilities that can be exploited across systems, networks, and applications, along with the severity levels and any recommendations for remediation. The results help understand risk exposure, security posture, compliance readiness, and the effectiveness of patch management processes.
Where can you find this metric?
This metric is found on vulnerability management tools such as Rapid7 InsightVM and Nessus.
Here’s what the Nessus dashboard looks like:
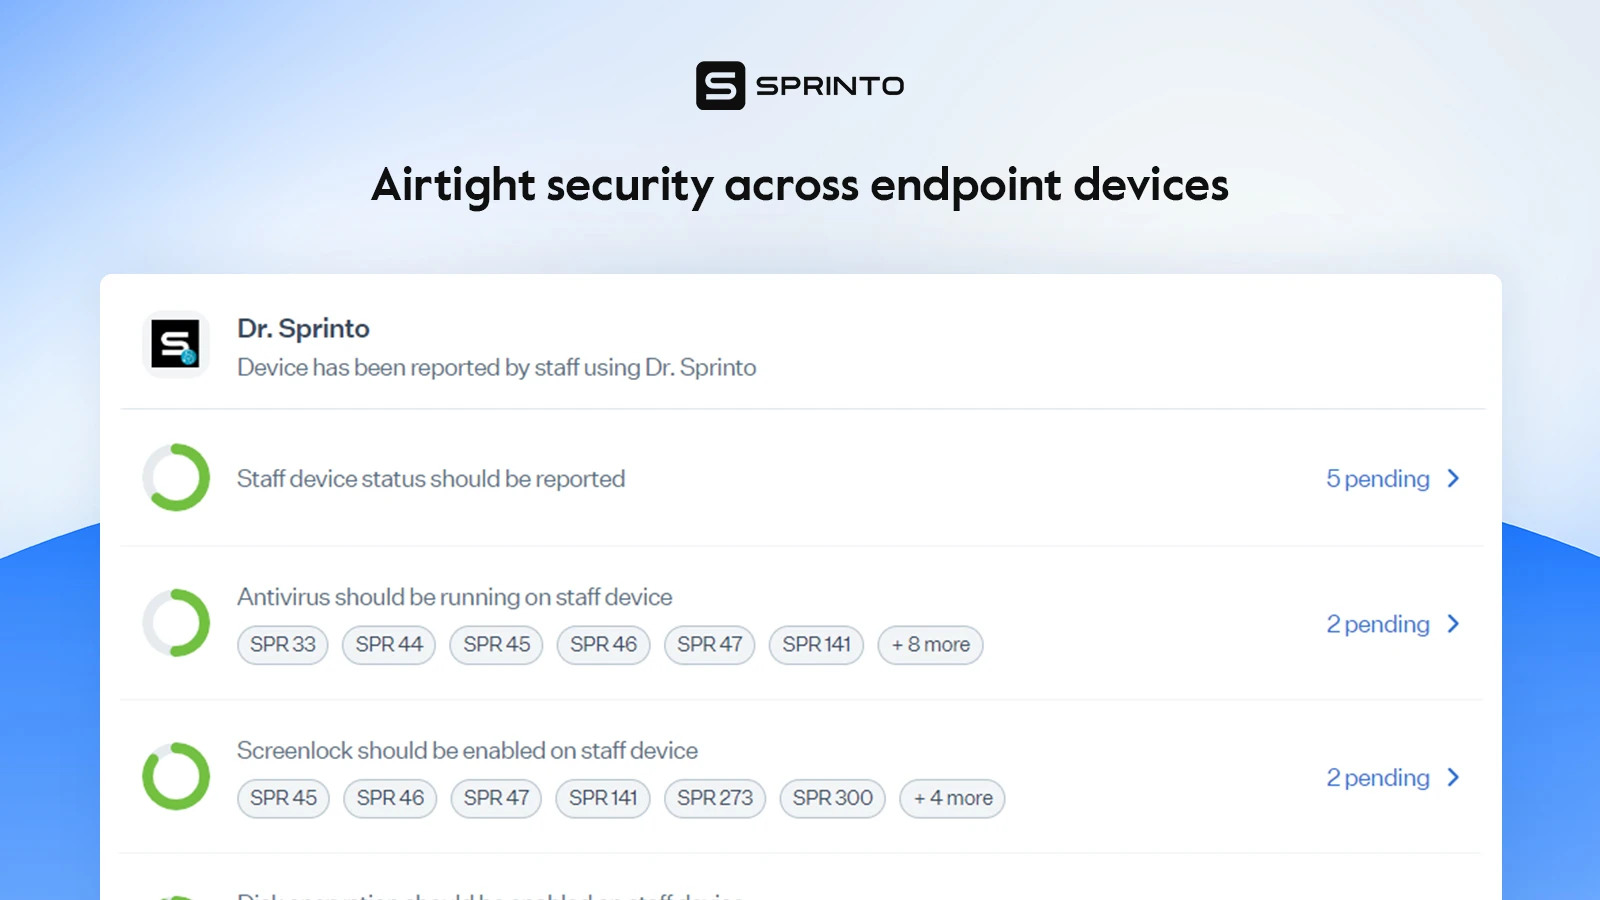
10. Endpoint protection coverage
Endpoint protection coverage is the percentage of an organization’s endpoint devices, such as laptops, desktops, IoT devices, or mobile devices, that are protected through a range of tools. These tools can be endpoint detection and response (EDR) tools, firewalls, antivirus software, or advanced threat protection systems that safeguard these endpoints against malware attacks, ransomware, unauthorized access, and other potential threats.
Where can you find this metric?
Endpoint protection tools like Microsoft Defender for Endpoint can help you track these metrics. Sprinto also has an in-built MDM tool, Dr Sprinto, that tracks endpoint protection coverage.
11. Identity and access management metrics
Identity and access management metrics provide insights into how user identities are managed and what are access-related risks. Tracking these metrics helps understand the gaps in compliance with access policies and initiates improvements to minimize insider threats and unauthorized access. Some IAM metrics you can track include multi-factor authentication adoption rate, access review completion, offboarding and access removal, and role-based access coverage.
Where can you find this metric?
Identity and Access Management tools such as Okta and Sailpoint can help you track IAM metrics.
Here’s an example from Sailpoint:

Get real-time insights with Sprinto
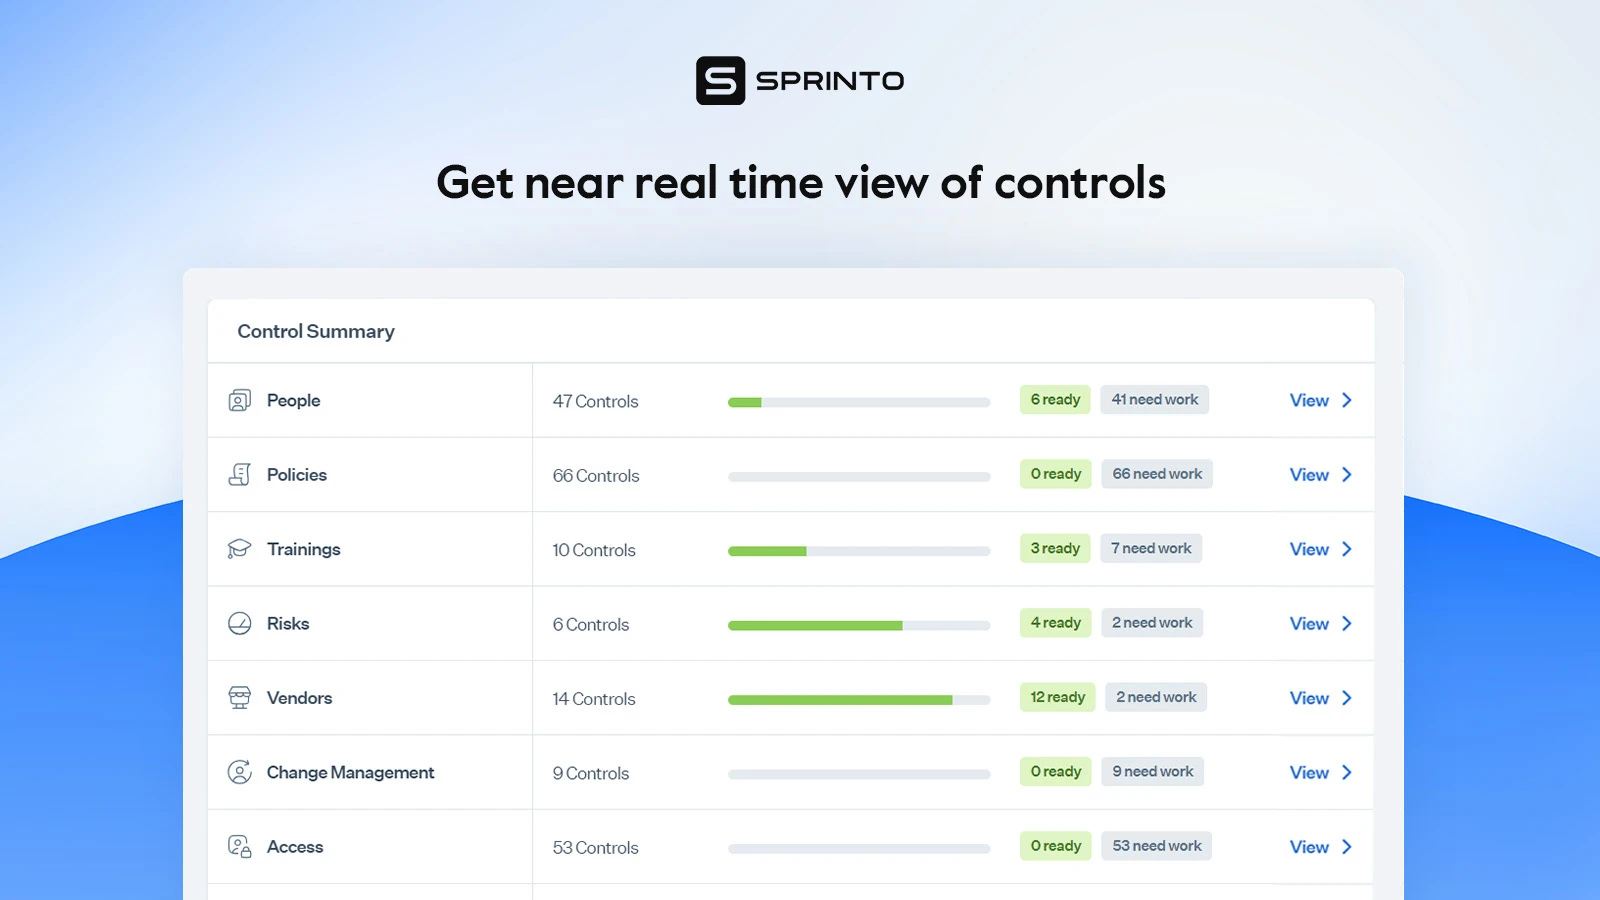
12. Control readiness for compliance
Control readiness for compliance indicates the percentage of controls that are close to meeting the compliance requirements based on framework applicability. It highlights the gaps in control implementation and is necessary for audit preparedness and risk mitigation.
Where can you find this metric?
Compliance automation tools such as Sprinto can offer you real-time data on control readiness.
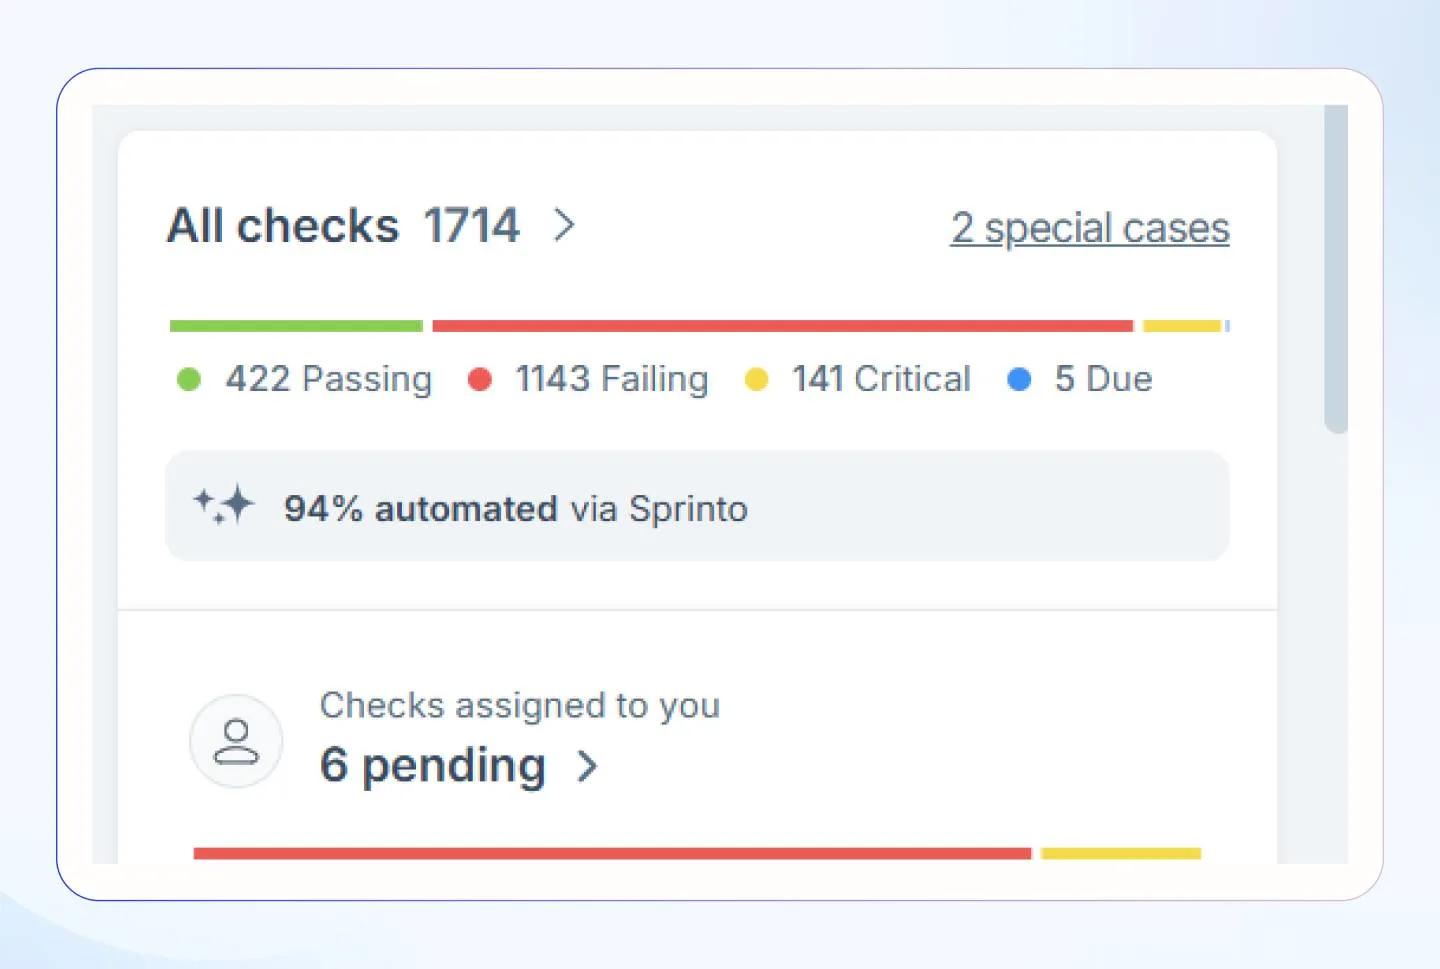
13. Control testing results
Control test results indicate how adequate the controls are in mitigating the risks and meeting compliance requirements. The dashboard view gives a quick snapshot of the control environment to understand whether the controls function as intended.
Where can you find this metric?
Once again, platforms like Sprinto or Metricstream can help you track control testing results.
Here’s how it’s displayed on Sprinto:
14. Breach costs
Breach costs indicate the financial impact after a data breach and include costs related to breach discovery and mitigation, downtime, any fines and penalties, and customer loss. This is an important insight for the board as it enables them to decide on cybersecurity investments.
Where can you find this metric?
Tools like IBM QRadar can help you track the financial impact of cybersecurity incidents and help businesses understand breach-related costs.
Steps to create a cybersecurity dashboard
There are two ways to create a cybersecurity dashboard: One is to consolidate data from diverse sources and create a unified dashboard, and the second is to use integrated and automated platforms.
Manual approach:
1. Determine key objectives
For a cyber security dashboard, the key objectives will revolve around two things—understanding who it is meant for, such as executives, security analysts, IT teams, or for all, and deciding what metrics should be tracked to support critical decisions such as risk management, compliance monitoring or incident response. You can choose from MTTD, MTTR, control readiness, risk scores, and other areas of focus from the list above.
Align dashboard KPIs to board questions. Use this guide to turn security data into exec-ready stories and decisions.
2. Identify data sources
The next step is to identify the data sources from where each of these metrics will be derived. These can be SIEM, ticketing, endpoint detection, and compliance tools. If you do not have dedicated tools for everything, let’s say for security training completion, some of these inputs will be manually captured.
3. Start integrating data
To pull data from relevant tools, you’ll need APIs or Extract, Transform, Load (ETL) tools that extract and load data into a centralized repository. Many of these tools, such as SIEM tools, will offer APIs with real-time capabilities. However, you’ll have to check the capabilities of each tool and set up real-time configurations for the ones that do not support ongoing updates, as cybersecurity is all about staying ahead of threats.
4. Choose a dashboard platform
Unless you want your metrics on an Excel sheet, you’ll need a dedicated cybersecurity dashboard platform to consolidate and display all relevant metrics. You can use tools like Tableu or looker to create your dashboard. Make sure the solution is customizable so you can adapt it to your business context and needs.
5. Design, test, and refine the layout
Once you’ve chosen a customizable platform, start working on the layout design which involves grouping and placing the metrics, adding visuals such as graphs and charts and any filters or drop-downs if required. Gather feedback from stakeholders on the simplicity and design of the dashboard and test for data accuracy to make any improvements.
6. Regularly update and maintain
A dedicated security team member must regularly review the dashboard for maintenance, bug-fixing, and updating it with any new data as per company requirements. The relevance of the dashboard must be periodically discussed with the senior management to enhance the reporting capabilities over time.
Sprinto approach:
On the other hand, you can opt for an integrated solution like Sprinto that’ll cover most of the metrics you need to stay abreast of cybersecurity and compliance. And there are two reasons why we’d want you to consider this approach:
- The above steps require a lot of manual effort and coordination that’ll require bandwidth and distract you from mission-critical tasks.
- The manual approach will require you to gather many tools, leading to a sprawl of cybersecurity tools, a rising concern in today’s world.
According to a report by Panaseer, big businesses are using an average of 76 tools, which is huge! This leads to a situation where managing the solutions becomes a problem for the CISOs, and there is duplication and overlap while increasing the security budgets.
Using a comprehensive and integrated solution like Sprinto can eliminate the need for multiple tools while minimizing manual effort and maximizing output.
AI-Powered cybersecurity dashboards
The predictions for 2025 say that, on one hand, we’ll see AI in cybercrime for advanced security threats and attacks. On the other hand, the demand for AI-driven cybersecurity solutions will increase because AI cybersecurity is the only way to deal with AI threats.
This underscores the need for real-time threat detection, machine learning algorithms, incident correlation and predictive analytics to enable faster decision-making and minimizing the time required for incident response. And that’s where AI-powered cybersecurity KPI dashboards will come into play.
AI cybersecurity dashboards take up everyday monitoring and analytics tasks while creating more time for security professionals to build things that maximize business value. They enable organizations to move from a reactive to a proactive approach, ultimately improving the security posture.
Here’s an example: Check out how Sprinto uses AI for Vendor due diligence:
Get out-of-the-box reports with Sprinto dashboard
One mistake that companies make while creating and finalizing their cybersecurity dashboards is to make them overwhelming to offer a comprehensive view. The goal, on the other hand, is to paint a high-definition picture in a single view and offer rich visualizations for grabbing attention on the right details. Enter Sprinto.
The next-gen GRC tool has all the critical information about your cybersecurity programs, including risks, controls and tasks. The comprehensive solution pulls this data directly from the source to quickly generate easy-to-understand metrics and visualizations that are accurate and based on real-time data. Everything is easy to digest, suitable for both C-suite and other stakeholders, and helps understand the health and stability of the organization’s security and compliance posture without the overwhelm.
Take a platform tour to understand the platform’s capabilities and kickstart your journey.
FAQs
What is the executive dashboard in cybersecurity?
A cybersecurity dashboard for board of directors or the executive dashboard provides a quick snapshot of organization’s cybersecurity posture summarizing the key metrics, cyber threats and risks to enable them to make well-informed decisions. It usually offers a birds-eye view of the current security landscape without delving into the technical specifications and helps the leaders track the effectiveness of the security efforts.
What are the benefits of a security dashboard?
A security dashboard offers a centralized view of the cybersecurity and compliance posture, enhances company’s situational awareness, streamlines reporting, enables better risk prioritization and facilitates well-rounded decisions.
What makes a good cybersecurity dashboard?
A good cybersecurity dashboard is user-friendly and customizable, offers real-time and actionable insights while integrating with other security solutions and provides a high-level as well as detailed view for both technical and non-technical stakeholders.

Payal Wadhwa
Payal is your friendly neighborhood compliance whiz who is also ISC2 certified! She turns perplexing compliance lingo into actionable advice about keeping your digital business safe and savvy. When she isn’t saving virtual worlds, she’s penning down poetic musings or lighting up local open mics. Cyber savvy by day, poet by night!
Go beyond the surface and uncover the governance, risk, and compliance insights that actually matter.


Win digital goodies for boardroom success


Explore more


research & insights curated to help you earn a seat at the table.