Risk assessments are like blueprints for your risk management strategy, mapping out the strongholds and weak spots with precision while meticulously detailing where to focus your resources.
When you know the business impact tied to each risk in different risk categories and their likelihood of occurrence, you can easily make strategic decisions like which risks to accept, which risks to tolerate, which risks to mitigate, and with what intensity.
That’s where the risk assessment matrix comes into play, transforming a jumble of arbitrary risks into a clear, actionable game plan.
In this article, we explain what a risk assessment matrix is, why you need it, and how you can build one to guide your risk management strategy.
What is a risk assessment matrix?
A risk assessment matrix is a key tool for visualizing risk severity. Pairing it with automated risk management helps organizations move from visualization to active mitigation. The matrix categorizes risks into risk ratings like high, medium, and low, revealing both how likely each risk is to occur and its potential operational, financial, or regulatory impact on your organization. This clear framework helps security teams identify which risks need immediate attention and which can be monitored over time.
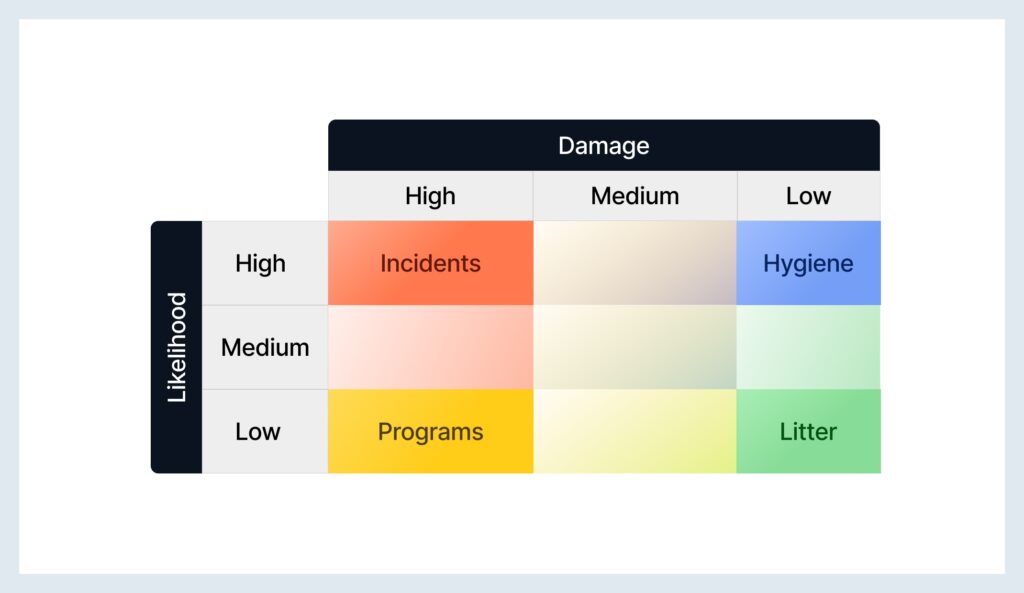
Typically, it’s a grid where one axis represents the likelihood of a risk occurring (from low to high), and the other represents the impact of the risk profile. As a result, when operational risks are placed on the grid, they reveal a clear picture of the ones that can be dodged, the ones that are operationally critical to fix, and the ones that should be combated over a period of time.
How does the risk assessment matrix work?
A risk matrix is a visual tool that categorizes risks into three bands of severity—high, medium, and low. It offers a snapshot of the threat landscape relevant to your business and how your defenses are fair against it.
For example, let’s assess risks for a financial services company.
Let’s consider an assessment for phishing risk. In that case, the probability of a phishing attack on a business is very high, and the severity of a phishing impact in most cases is major; as risk impact = severity*probability, the overall potential impact of risk is high.
Steps to Plan Risk Assessment Matrix
Building your very own risk assessment matrix consists of 5 steps that help you identify your threat landscape, gauge their probability of occurrence for your business, and determine the severity of risks if they occur.
Here is a step-by-step process for building your risk matrix:
1) Identify risk factors
If you are running a business, you face negative risks, such as operational, financial, or strategic risks. Some are natural byproducts of business operations or fast-paced growth, and some are driven by external threat actors.
For example, here is a list of some potential risks:
- A phishing attack could negatively impact your business
- Loss of supply chain network due to a system compromiseLoss of customer data due to a ransomware attack
- Non-compliance against data protection regulations invites legal risks. Mapping your risk matrix against established compliance frameworks helps identify regulatory exposure early.
- Natural disasters damage data centers, disrupt operations, and create opportunities for threat actors to exploit some vulnerabilities
2) Determine probability and impact
Once you have understood the landscape relevant to your business, you can start assessing each risk qualitatively by color-coding them into red, green, or yellow or quantitatively by assigning a value range to each color.
For example:
- Risk probability can be rated on a scale (e.g., Low(0-3), Medium(4-7), High(8-10))
- Severity can be rated based on financial loss, reputational damage, and regulatory penalties (Low, Medium, High)
3) Calculating the risk impact (Severity*Probability)
In rudimentary calculations, risk impact is a product of severity and probability. This offers a great starting point when prioritizing risk management efforts. For example, here’s how you calculate risk impact based on the likelihood and severity of the risk:
| Risk | Probability | Severity | Impact |
| Phishing attacks | Very likely | Major | High |
| Ransomware attack | Likely | Major | High |
| Non-compliance | Unlikely | Severe | Medium |
Once you have assessed risk impact using the table above, you can start plotting them on the risk matrix for visual representation and get buy-in or mitigation initiatives from stakeholders. Assume the axis as your impact and the y-axis as the likelihood of occurrence.
Here’s an example of a risk matrix template:
4) Determine Actions
Once you have identified risks and sorted them on the matrix as per risk criteria and impact, it’s time to determine the urgency and severity of mitigating actions needed.
For example:
- Actions for high-impact risks (e.g., phishing attacks, ransomware attacks):
- Implementing MFA (multi-factor authentication) and continuously assessing controls can help mitigate the impact of phishing attacks and even account compromise.
- Email filtering solutions can prevent phishing emails from reaching your employees, reducing the chances of a compromise altogether.
- Conducting congruent and parallel backups to recover from a ransomware attack without huge losses.
- Segment network to limit the spread of an attack
- Actions or medium and low impact risks (e.g., non-compliance):
- Review and update compliance policies regularly, conduct compliance audits, and train employees on compliance requirements.
- Establish continuous monitoring tools to help you curb compliance or security threats.
How do you calculate the likelihood of occurrence of a risk?
Historical Data Analysis: Hostircally, numerous organizations, regulatory bodies, and frameworks have aimed to analyze past events and anomalies to inform future risk scores. Looking at the historical data, frameworks like ISO, SOC, and NIST outline the likelihood of the occurrence of different types of risks.
By examining data sets and recommendations from such frameworks, organizations can develop their risk likelihood benchmarks for risk assessments.
Intuitive Judgment: Experts who spend years in the industry and grasp the underpinning knowledge of eco-systems of risks, geopolitics, business, and tech understand what risks can occur at what probability in which industries. Thus, blending intuitive and informed judgment and historical data analysis can help you tailor your risk impact scores to their relevance to your business.
For example, if you think that a risk has a 20% chance of occurring within the next year, you can classify the risk likelihood as unlikely. If it’s more than 30%, you can classify it as likely, or if it’s very low, you can classify it as rare, and so on.
Industry benchmarks with Sprinto: Sprinto empowers you to assess and visualize the true impact of security risks based on trusted industry benchmarks so you broach risks with confidence, prioritize better, and manage systematically. Use Sprinto’s comprehensive risk library to scope security risks across your business’s assets and processes.
Manage risks with precision
Risk Models and Simulation: When assessing risks, models and simulation methods, like Monte Carlo simulations, are employed to gauge the probability of outcomes by using random variables and probability distributions to represent various scenarios.
Deepen your risk management program with Sprinto
Sprinto enables you to rigorously categorize different levels of risk and assess impact – empowering you to visualize your entire risk environment and manage risks with precision. It connects with your cloud stack to detect misconfigurations and anomalies with the speed and accuracy a solid risk management program demands. Sprinto brings a comprehensive risk register with trusted industry benchmarks for impact, so you can quickly analyze the risks relevant to your industry and build a list of risks based on data, not just intuition.
Collect or manage risk information, owners, and mitigation plans from one centralized dashboard on Sprinto. As you progress and deepen your risk management, Sprinto automatically captures evidence of control performance and builds a clear audit trail toward any compliance framework.
Rationalize your risk management and compliance program
FAQ
Yes, it is used to identify and prioritize risks based on the likelihood of their occurrence and the severity of their impact. It helps organizations manage and mitigate risks by visualizing them in order of priority, making it easier to focus on the most critical threats.
The likelihood and impact of each risk are determined through a combination of historical data, industry standards, expert judgment, and scenario analysis. The possibility is assessed as the probability of the risk occurring, while the impact is evaluated based on the potential damage or loss the risk would cause. These factors are then rated on a scale (e.g., Low, Medium, High) to help make informed decisions.
Yes, the risk matrix can be adapted for the level of risk, including strategic, operational, financial, and compliance risks. It is versatile enough to be customized for different industries and specific organizational needs. However, the matrix should be regularly updated to reflect changes in the risk environment and organizational priorities.
Risk appetite plays a crucial role in a risk assessment matrix by determining the threshold levels, scoping the risk environment for risk acceptance, and guiding decision-making on which risks to mitigate, accept, transfer, or avoid based on an organization’s tolerance for risk and strategic objectives.
A risk assessment matrix is used by rating each risk based on its likelihood and impact, then plotting it on a grid to prioritize low, medium, or high-risk issues for mitigation.
A risk assessment matrix is a visual tool that evaluates risks using probability and severity scores; for example, a phishing attack with high likelihood and major impact would be classified as a high risk.
Risk matrices are commonly calculated using the formula: Risk Score = Likelihood × Impact, where each factor is assigned a numerical value (such as 1–5) to determine overall risk severity.

Author
Virgil
Virgil is a marketer at Sprinto who combines his media savvy with his cybersecurity expertise to craft content that truly resonates. Known for simplifying complex cybersecurity and GRC topics, he brings technical depth and a storyteller’s touch to his work. When he’s not busy writing, he’s likely exploring the latest in cybersecurity trends, debating geopolitics, or unwinding with a good cup of coffee.Go beyond the surface and uncover the governance, risk, and compliance insights that actually matter.


Win digital goodies for boardroom success


Explore more


research & insights curated to help you earn a seat at the table.